Prediction Explorer
The Prediction Explorer allows you to measure the predicted lifetime value (LTV) of various customer cohorts over time to estimate the long-term revenue that may be driven by those cohorts.
Available settings
- Filters: Yes
- Segments: No
- Cohort selection: Yes
Change log
- December 2024: We discovered and fixed a bug that caused predicted LTV of cancelled subscriptions to be fully included in the data, when instead a very small portion of this predicted LTV should be included to account for uncancellations and reactivations.
Terminology
| Term | Definition |
|---|---|
| Lifetime value (LTV) | The total revenue (value) generated for a cohort within some defined period (lifetime). Total revenue refers to the total amount paid by customers through the stores before taxes or commissions are deducted. |
| Realized LTV | The revenue that has already been generated (realized) for a cohort within some defined period. |
| Predicted LTV | The revenue that has already been generated (realized) for a cohort, plus the additional revenue that we predict will be generated from the subscriptions in that cohort within some defined period. In order for a cohort to have predicted revenue, it must be younger than the defined lifetime being measured. |
Cohorts
The Prediction Explorer supports three different cohort definitions:
- New Customers: The count of customers cohorted by their first seen date by RevenueCat.
- Initial Conversions: The count of customers cohorted by their first conversion date. Conversion includes paid or unpaid and subscription or one-time purchase.
- New Paying Customers: The count of customers cohorted by their first purchase date.
Comparing cohort definitions
Each cohort definition is a unique way of grouping customers together to understand how each unique cohort performs over time.
Because these measures each have unique cohort definition, each period references different groups of customers. For example, the Apr '24 cohort of New Paying Customers may include some customers who happened to also be first seen in Apr '24, and are therefore in the Apr '24 cohort of New Customers, but it may also include some customers who were first seen in prior months.
In addition, the Apr '24 cohort of New Customers may include customers whose first payment won't occur until after Apr '24.
Therefore, these different cohort definitions should not be thought of as a conversion funnel for the period they reference. Rather, they are independent ways of grouping customers together to understand how each unique cohort performs over time.
Lifetime Value (LTV) Prediction
RevenueCat predicts the lifetime value (LTV) of paid subscriptions based on the prior retention rates of subscriptions on the same product, or of a mix of fallback dimensions when sufficient data for the purchased product is unavailable. Our dataset of >50k apps, >450M subscriptions, and over $4B tracked revenue through our platform allows us to reliably estimate lifetime value outcomes.
When we predict LTV
We predict up to 24 month LTV for all paid subscriptions that are not cancelled or expired. Whenever a data point contains predicted revenue, it will be styled with light green or yellow on the right side of the diagonal divider in the table.
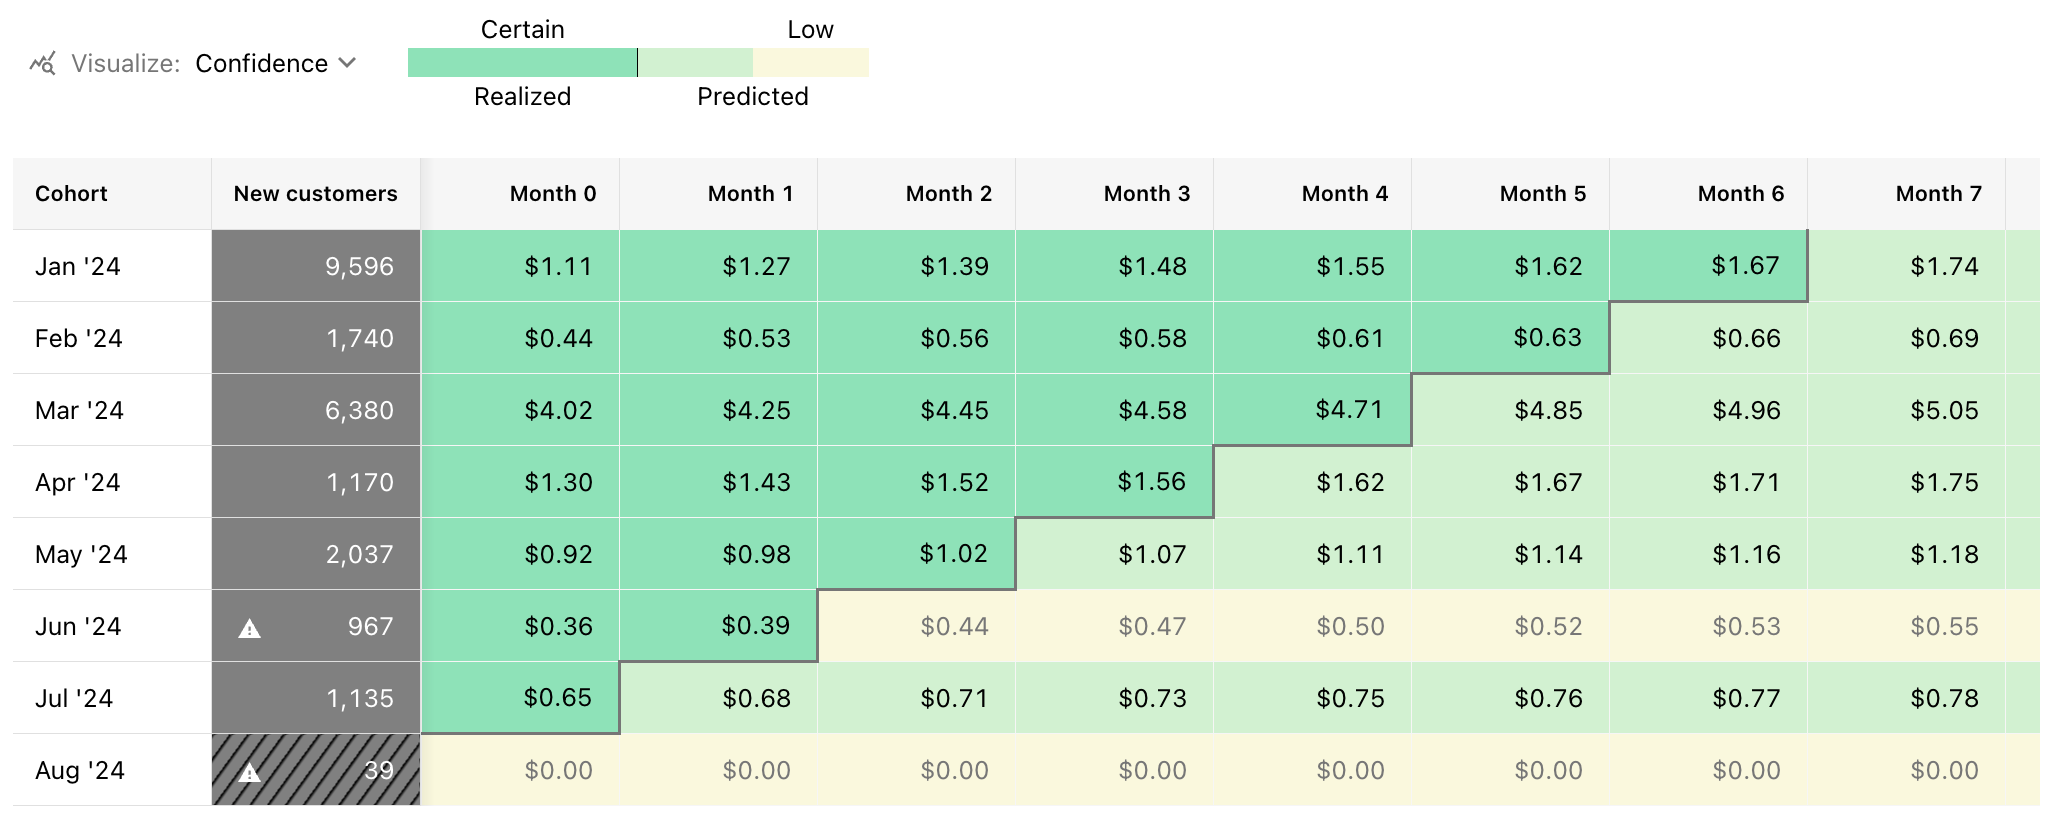
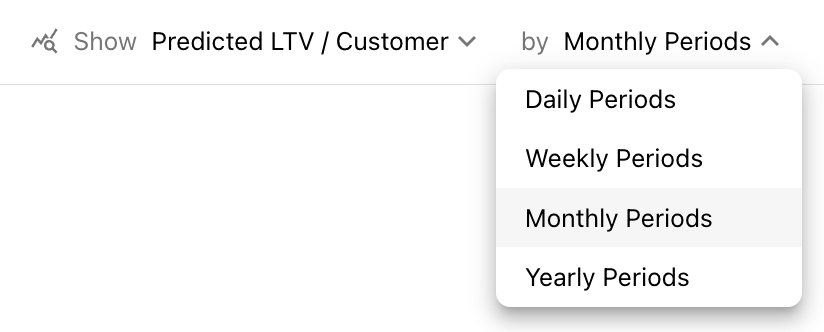
You can use the period selector to look at daily, weekly, monthly, or yearly periods and the LTV we predict will be added in each one (for up to 24 months after the start of each paid subscription in the cohort being measured)
Other notes
- We will predict future revenue for up to 24 months from the first purchase date of a subscription, and will always show up to 24 months of performance for a given cohort. In the future, when we extend the time that we're predicting future revenue for, those additional periods will be provided in the chart as well.
- We include the payment that may be made exactly at month 24 in our predictions (e.g. the 3rd potential payment for a yearly subscription which originated on 2020-01-01, and had renewal opportunities on 2021-01-01 and 2022-01-01)
- We do not predict increases in LTV from non-subscription revenue (e.g. lifetime purchases, consumables, etc.)
How we predict LTV
We predict LTV by building a survival curve of sets of subscriptions, translating that survival curve into renewal opportunities for each specific subscription, and then modifying the survival curve based on the behavior of the specific subscription we're making a prediction for.
Survival curves
Survival curves illustrate churn probabilities over time, which can be easily converted into renewal probability distributions. To generate these curves, we first analyze subscriptions for each product and fallback dimensions (e.g., store category), determining the duration of active subscriptions, the number of renewals, and the current status. Subsequently, we select an appropriate statistical distribution (e.g., exponential distribution) and fit the subscription data to these distributions to generate the survival curves.
These survival curves are updated daily to ensure we're always using the latest data to estimate the future survival rates of a given subscription set.
Subscription sets
When a unique product has had enough prior subscriptions created for it to build a reliable survival curve, we'll use that product's survival curve as the base to predict LTV for all future subscriptions on that product.
We treat each unique subscription product that a customer purchases as a unique subscription. Therefore, when a product change occurs, such as from a monthly product to a yearly product; the monthly subscription will be treated as churned when it ends, and a new yearly subscription will be created and have it's lifetime value predicted for 24 months following the first purchase date of that yearly subscription.
If there is not enough data for that product, we'll use fallback survival curves that are built on the dimensions that have the most meaningful impact on LTV, such as store & product duration.
Auto renew status and its effect on LTV
The primary signal we use to determine whether a subscription's survival curve needs to be altered from the average for its product is its auto renew status. Or, in other words: a subscription which has disabled auto renewal has a far lower likelihood of surviving until its next renewal compared to a subscription which is still set to auto renew.
That also means that subscriptions with different attributes, such as those from different countries or with different app usage patterns, will still have different LTV predictions generated for them if this underlying attribute difference also causes them to cancel their subscriptions at different rates.
It's important to note that cancellation rates also take time to be observed in a cohort. Because of that, we recommend waiting until a cohort is at least 7-14 days old before comparing their predicted LTV with other cohorts.
On reliability & accuracy
When using the Prediction Explorer to anticipate future performance, its important to keep in mind that many variables can affect the true performance of a cohort over time, such as:
- Differences in involuntary churn vs. prior cohorts
- Differences in how early or late in a given renewal period subscriptions typically cancel
- Changes to the product being used that materially change likelihood to cancel or retain
In testing our prediction model, we've observed that >75% of Products with at least 2,000 paid subscriptions have 12 month LTV predictions that are >90% accurate. Meaning, the Predicted LTV for those subscriptions is within 10% of the true Realized LTV we observed for those subscriptions.
However, there are also some observable patterns in that testing that influence accuracy:
- Yearly products are most reliable, followed by monthly, and then weekly. Shorter durations produce greater fluctuation in LTV when measuring long lifetimes. Because of this, we recommend waiting at least 28 days before relying on long-term predictions for weekly products.
- App Store products are generally more reliable than Play Store & Stripe products.
- Products with a higher volume of historical subscriptions have higher reliability.
Reliability indicators
In the Prediction Explorer we'll distinguish between two types of predictions:
- Predictions made for cohorts that are too small to be reliable
- Predictions made for cohorts of a sufficient sample size
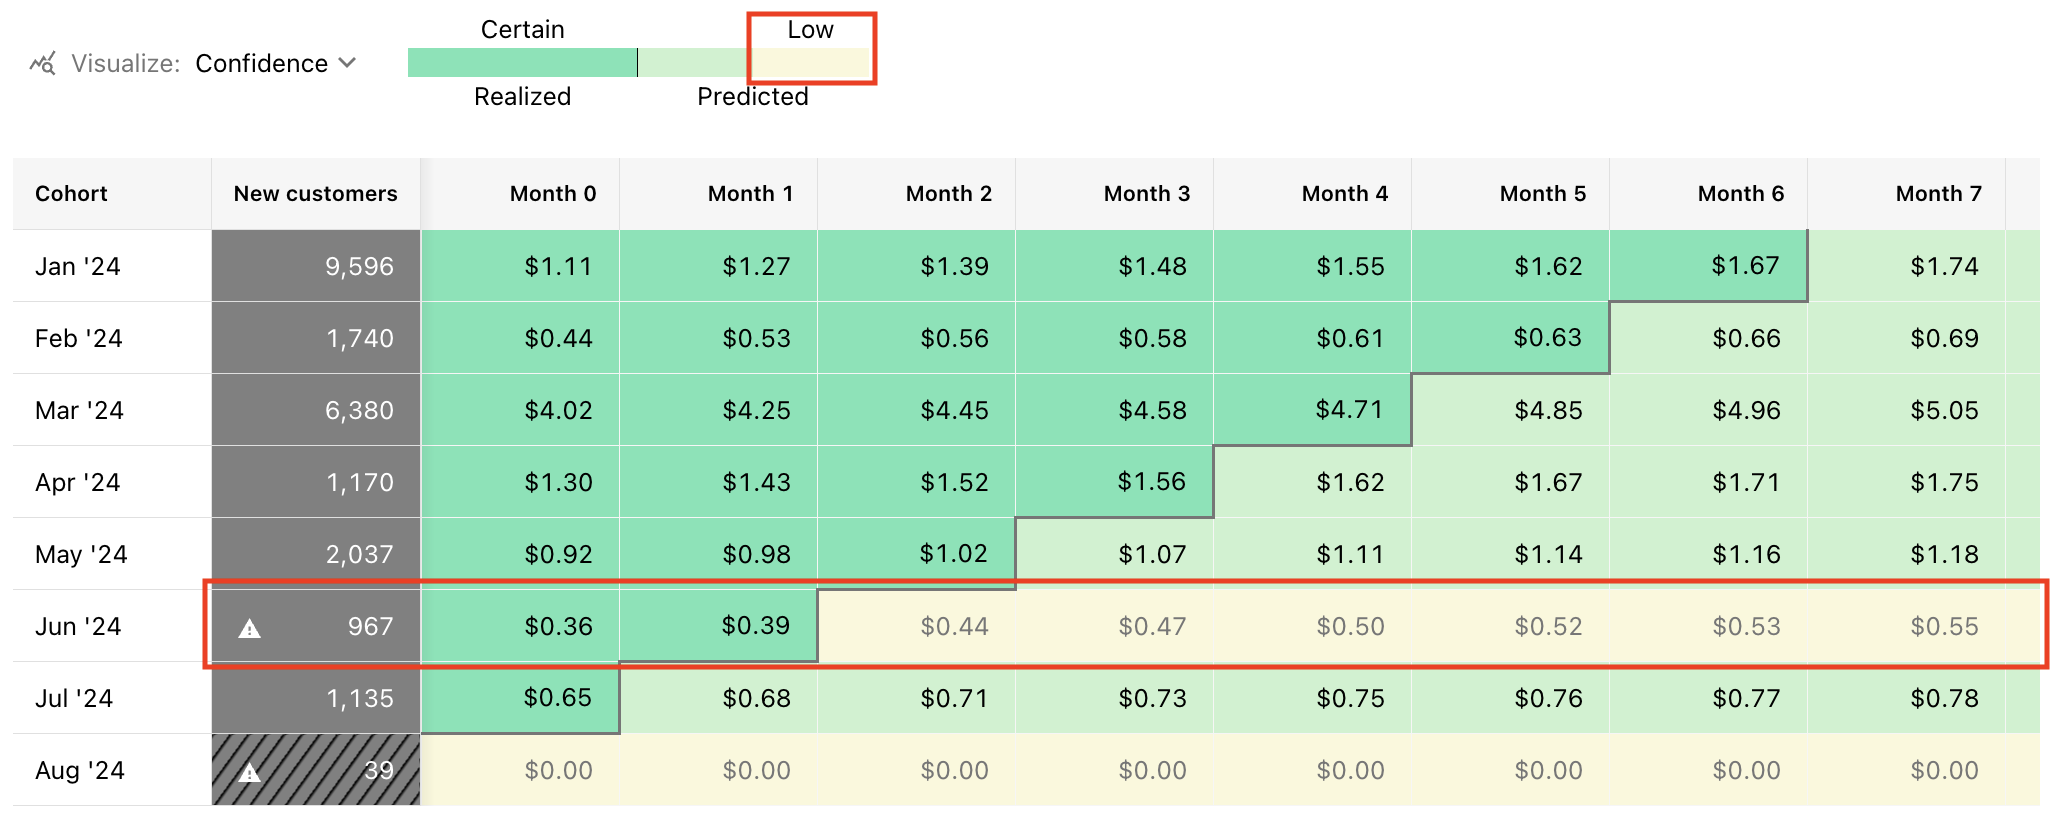
When a cohort is too small, and therefore its predictions should be taken with extreme caution, we'll indicate that with a tooltip and yellow cell shading to distinguish these as our lowest confidence predictions:
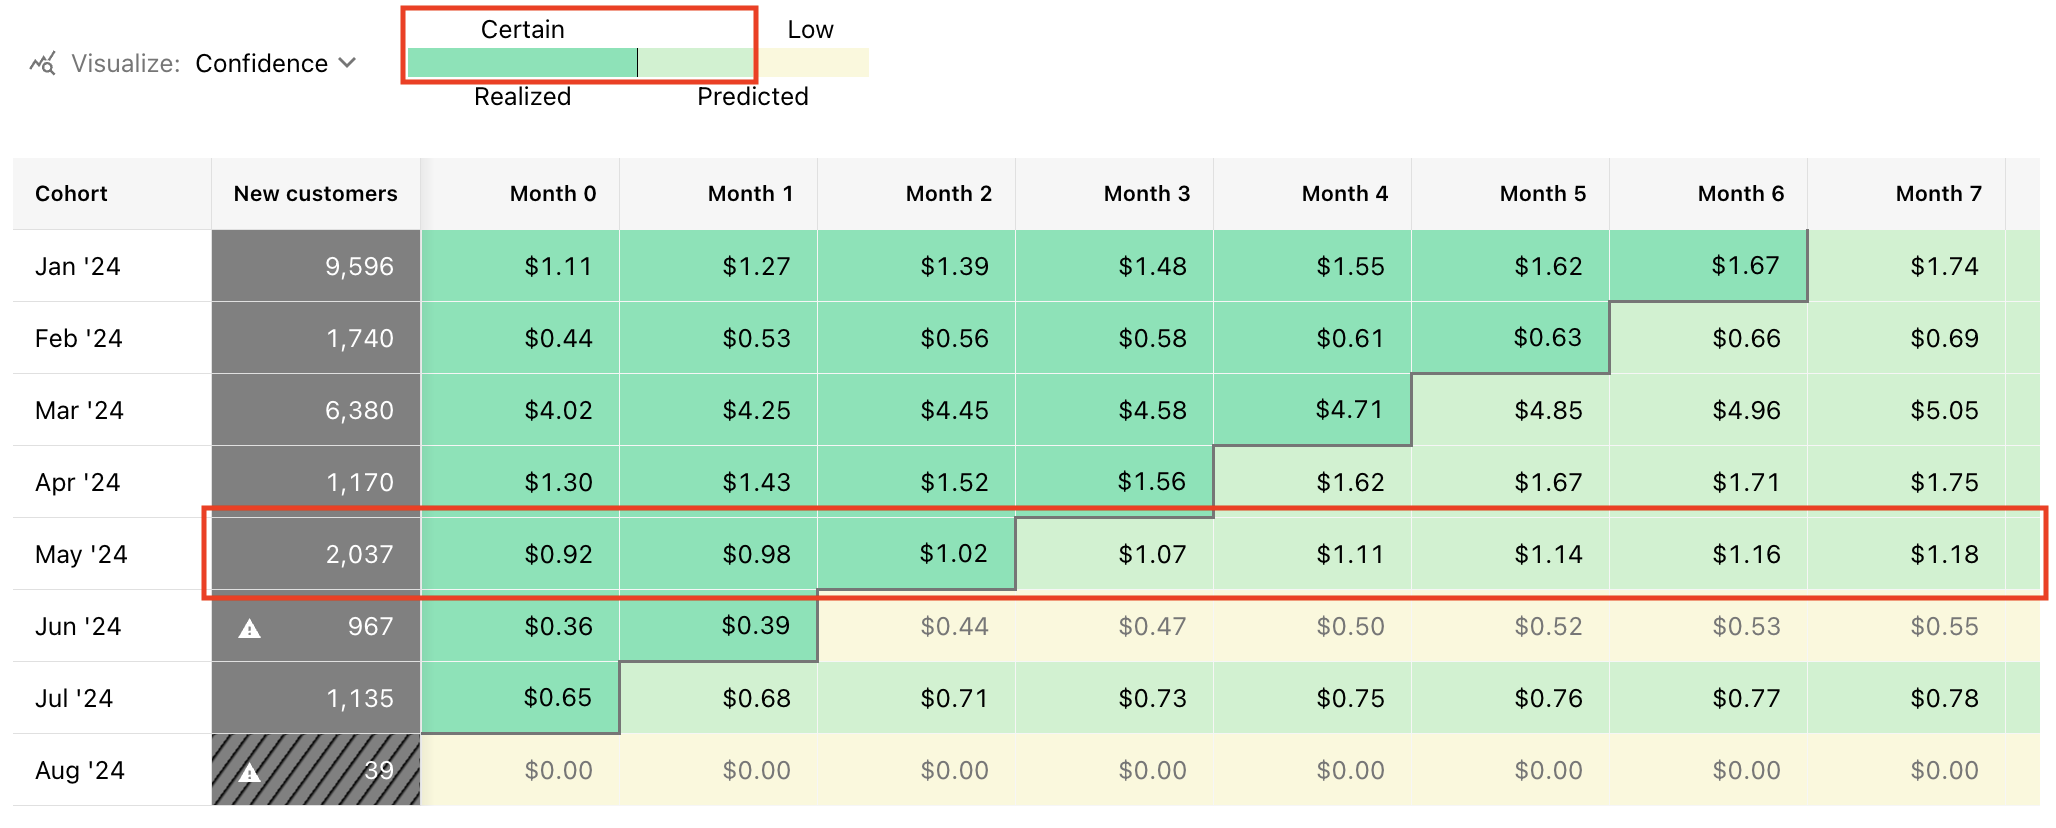
When a cohort has a sufficient sample size of customers and subscriptions for us to provide a more reliable prediction for it, we'll indicate that with a light green cell shading to distinguish these as predicted values vs. other darker green cells which only contain Realized LTV:
All future lifetime value predictions contain some degree of risk and uncertainty, and should therefore be used with caution in analysis when comparing with certain values like Realized LTV.
Other limitations
- Products which had a price change may have less accurate predictions for a period following the price change if the new survival rates are not fully observed through changes in cancellation behavior.
- We do not (yet) predict conversion to a paid subscription from non-paying customers, which means the total predicted LTV of a cohort only includes those subscriptions that have already converted to paid, and may change over time if additional subscriptions convert to paid.
- For new products, we use survival curves of similar products with enough historical data. This approach, on average, gives reliable results, but your product's retention could turn out to be different than our similar set. Because of that, predictions for products with little historical data should be used with caution.
A prior limitation of our prediction model was poor performance for Stripe subscriptions, but that has since been addressed and removed from the list of current limitations.
How to use the Prediction Explorer in your business
The Prediction Explorer can be used to answer many different questions, like:
- At an average CAC of $x, what is my estimated time to payback?
- How can I expect LTV to grow over time for recent cohorts vs. prior cohorts?
- Do subscriptions on Yearly Product A have a higher 24 month LTV than those on Monthly Product B?
- How does the predicted LTV from a given Apple Search Ads campaign compare with the predicted LTV of other subscriptions?
- Which countries have a high enough predicted LTV to support testing paid marketing campaigns?
Calculation
Revenue of New Customer Cohorts
For each period, we:
- Count the New Customers that were first seen in that period
- Provide the sum of revenue already generated by that cohort in each subsequent period
- Add the sum of all revenue we predict will be added from existing paid subscriptions in future periods that are not yet complete (up to 24 months)
Realized LTV of New Paying Customer Cohorts
For each period, we:
- Count the New Paying Customers that made their first payment in that period
- Provide the cumulative sum of revenue generated by that cohort as of each subsequent period
- Add the cumulative sum of revenue we predict will be added from existing paid subscriptions in future periods that are not yet complete (up to 24 months)
Realized LTV / Customer of New Paying Customer Cohorts
For each period, we:
- Count the New Paying Customers that made their first payment in that period
- Provide the cumulative sum of revenue generated by that cohort as of each subsequent period, divided by the count of New Paying Customers in that cohort
- Add the cumulative sum of all revenue we predict will be added from existing paid subscriptions in future periods that are not yet complete (up to 24 months), divided by the count of New Paying Customers in that cohort
FAQs
| Question | Answer |
|---|---|
| Does Predicted LTV measure revenue before or after store commissions, fees, and taxes? | Predicted LTV is calculated using the total revenue generated or predicted from each cohort, minus refunds, and therefore it does include revenue that the stores may deduct from your Proceeds due to commissions, taxes, or fees. |
| How can I distinguish realized vs. predicted periods in the CSV export? | Unfortunately, right now there is no indicator in the CSV export to distinguish between realized vs. predicted periods, so for the moment this can only be done manually through a date comparison or by referencing the Charts UI. |