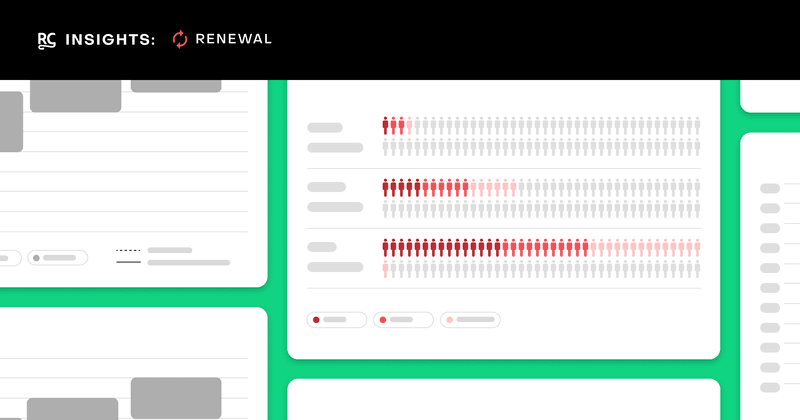
How many subscribers should you expect after one year?
Average retention rates at the end of one year

In our last post on renewal rates, we discussed why comparing different subscription durations is important. But keep in mind that renewal rates and retention rates are not the same thing. A renewal rate is the percentage of customers who choose to renew their subscription after it expires. A retention rate is the percentage of customers who haven’t canceled their subscription within a certain period of time.
Today, we’re talking about retention rates and what they look like for weekly, monthly, and annual subscriptions, and what they look like after one year.
If you start with 100 subscribers, how many will you have at the end of one year?
We analyzed 10,000+ iOS and Android subscription apps to understand what retention rates look like for weekly, monthly, and annual subscriptions over the course of a year. Here’s what we found:
Weekly subscriptions: In our analysis, weekly subscriptions have a median retention rate of just 3% after a year (this figure is just 1% for the lower quartile and 4% for the upper quartile of apps).
Monthly subscriptions: Monthly subscriptions have a median retention rate of nearly triple that, at 11% after a year (5% for the lower quartile and 19% for the upper quartile).
Annual subscriptions: Nearly three times higher than the median retention rate for monthly subscriptions, the median retention rate for annual subscriptions after a year was 28% (17% for the lower quartile and 43% for the upper quartile).
To put this into perspective, let’s say you had 100 customers subscribe to each of these offerings. After one year, you should expect to have 3 weekly subscribers, 11 monthly subscribers, and 28 annual subscribers still subscribed.

What can you do with this information?
1. Make decisions based on your app, not just benchmarks
Benchmarks are a great way to gauge how your app business is performing against the rest of the industry and can clue you into where you fall on the curve. But while benchmarks can help you identify areas for improvement, they don’t tell the full story.
Based on the above data, one might assume that an annual plan is the best way to retain your users and bring in the most revenue. It’s a fair assumption, but depending on your app’s product or service, a shorter subscription length might be a better fit.
It’s also important to consider when customers are churning throughout the year.
2. Evaluate your retention curves if you want to compare revenue from your offerings
Trying to figure out which subscription duration will generate the most revenue? Instead of focusing on the number of monthly subscribers that made it to the end of the year, look at the subscribers who didn’t make it that far. Did they churn at month 1 or month 11, and what does that tell you?
For example, let’s say today you gained:
- 100 monthly subscribers who pay $10 per month
- 11 annual subscribers who pay $100 per year
If your monthly subscribers all churn in month 1, then your annual subscribers would generate more revenue in a year, even though only eleven of them exist. But if your monthly subscribers all churn in month 11, your monthly subscribers would generate a lot more revenue over the course of the year.
Evaluating your retention curve over time and the prices of your offerings can help you draw comparisons between the expected revenue from each offering. From here, you’ll have the insight to make changes to your offerings (like discounts for longer subscriptions). You’ll also be able to anticipate when your customers may churn before it happens and take action to prevent it.
Here at RevenueCat, we’ve created a pre-built realized LTV chart that makes it easy to do this comparison. We also offer a subscription retention chart that shows how paying subscriptions renew and retain over time. Subscription start dates segment cohorts by default, but you can also segment by other attributes like country or product.
3. Look at your retention rates beyond the first year
You might be surprised at how high or low your retention rates are compared to these benchmarks. It’s important to remember that many apps are still relatively young and figuring out product-market fit and pricing, leading to lower retention rates.
Also, the retention curve generally flattens out over time, so you might find that your retention rates look more favorable at the end of year two. Customers who get enough value from your app to stay subscribed for the first year are likelier to stick around for the long haul.
That’s exactly what happens with the Greg app. After 12 months, Greg’s retention rate for their monthly subscription is 21%. But their churn rate slows significantly after 12 months, and by month 21, 18% of customers are still subscribed. In other words, Greg loses 79% of their monthly subscribers in the first year, but only loses another 3% in the subsequent 10 months.

We recently spoke with Greg’s founder, Alex Ross, about retention and other business metrics. Check out the full interview on YouTube.
You might also like
- Blog post
Is monetization hurting your app’s user experience?
Don’t trade short-term revenue for long-term trust. How ethical UX can still drive effective monetization.
- Blog post
Meta Ads in 2025: Expert tips from Marcus Burke
Marcus Burke discusses AI, UGC, and the lifespan of ad creatives.
- Blog post
The creative testing system that slashed our CAC (and scaled our spend)
We scaled Meta ad spend by 74.6% and dropped CAC 40%. Here’s how.

