Report Preview
Methodology & Data
- 75,000
- Subscription Apps
- $10B+
- Tracked revenue
This report draws on subscription app performance data from a wide range of apps that use RevenueCat’s platform. Our goal is to provide a comprehensive snapshot of how apps are performing under different scenarios, across both the iOS and Android ecosystems.
The anonymized benchmark data in this report is from all of those apps. More detail on our methodology can be found in the PDF report available for download on this page.
Want to see the 2024 data? Check out the report here.
Key insights
- 400X +
- The gap between winners and the rest is growing – At $8,880 the top 5% of newly launched apps make over 400x as much money after their first year, compared to the bottom 25% who make no more than $19. This gap has grown significantly since last year’s 200x.
- $0.63
- AI apps print money - but only if they stand out - Most AI apps see revenue per install above $0.63 after 60 days, matching only Health and Fitness ($0.63), at double the overall median of $0.31. But AI alone won’t drive success, differentiation does.
- 35%+
- Subscriptions aren’t enough anymore – 35% of apps now mix subscriptions with consumables or lifetime purchases. Gaming (61.7%) and Social & Lifestyle (39.4%) are leading the charge.
- 30%
- Churn hits hard and fast – Nearly 30% of annual subscriptions are canceled in the first month. If you don’t win them back over, at the end of that first year, they’re gone. Retention starts on day one.
- 36%
- Low prices keep users locked in – Most apps with cheap annual plans keep up to 36.0% of users subscribed after a year. High-priced monthly plans? Just 6.7% stick around.
See how you stack up with our Subscription Health Calculator
Calculate your app's score

Introduction
Twelve months ago, I joked about how AI was going to change everything for subscription apps. It did, but in ways I didn’t fully appreciate at the time.
AI-powered apps are outperforming a bunch of legacy categories already, and on top of that, AI-assisted development has made launching (and iterating) an app feel more like a weekend hobby project. Running a subscription business is still hard, but AI is letting us do more, faster and has created an incredible amount of disruption that now is a better time than ever to build and invest. Of course, it wouldn’t be a State of Subscription Apps report without us going completely overboard on data. Last year, I warned you it was “dense.” So this time around, we doubled down—literally. Twice the page count, more charts, and more slicing and dicing: we broke down metrics by category, platform, region, price point, engagement strategy, and probably a few other segments you never knew you needed. The result is a monstrous trove of insights that should keep you busy until next year’s version, which will probably come in a 3 volume set. Building a successful subscription app is easier said than done—even in the era of vibe-coded, one-shotted apps. My hope is that you’ll find the data you need in these pages to handle your next big challenge, whether that’s retention, pricing, or cracking into a new market. At RevenueCat, giving away information is one of our top 7 favorite activities, and we’re excited to keep pushing the envelope on what we can learn—and share—about this thing called apps.
Candlestick Charts
We often use candlestick (box-and-whisker-style) charts to visualize the bottom quartile, median, upper quartile, and P90 for a given metric (e.g., Revenue per Install, Renewal Rate, etc.). Here’s how to interpret them:
- Lower “Whisker”: Represents the Bottom Quartile (Q1). Apps below this line make up the lowest 25% of performers
- Lower Edge of the Box: Marks the Median (Q2)
- Upper Edge of the Box: Marks the Upper Quartile (Q3)
- Upper “Whisker”: Marks P90 (the 90th percentile)
- Outliers (if shown): Data points that are significantly outside the range of typical values are occasionally represented with individual markers beyond the whiskers
These charts help identify the spread and clustering of app performance. The “box” shows the bulk of the distribution (from the median to the upper quartile), and the whiskers show the extremes (bottom quartile and P90).

You're missing the full story without the full report
Download the full 263-page report for all sections including: Web Billing, AI Apps, and By-Category Breakouts.


Conversion
Download to trial
By category
- High-performing apps significantly outperform the median, proving the impact of strong onboarding and paywalls. In most categories, the top 10% convert downloads to trials at double or triple the median rate. This highlights how trial placement, personalized onboarding, and clear value messaging can boost conversions
- The lowest quartile conversion rates highlight a challenge for many developers. Even in high-performing categories like Health & Fitness, some apps struggle to turn downloads into trials. Testing trial length, paywall timing, and messaging is key to improving conversion rates, especially in impulse-driven categories like Gaming
- Subscription apps with strong habitual use cases tend to convert better. Business, Health & Fitness, and Productivity apps perform well, as users seek long-term solutions. In contrast, impulse-driven categories like Gaming and Media & Entertainment see lower conversion rates, making trial optimization even more critical
Download to trial conversion by category

By geography
- Trial conversion rates vary by region, with North America and Asia-Pacific leading. Emerging markets like MEA and Latin America show wider variability, highlighting differing user behaviors and purchasing power.
Download to trial conversion by geography

By price point
- Higher prices correlate with higher trial conversion rates. Contrary to expectations, apps with higher subscription prices see stronger download-to-trial conversion rates at the median. A median conversion rate of 9.8% for high-priced apps, compared to 4.3% for low-priced apps, suggests that users downloading expensive apps may already be more intent-driven
- Trial conversion is a quality-over-quantity game. While lower-priced apps attract more downloads, they convert a smaller share into trials. Higher-priced apps may naturally filter for more motivated users, meaning those who download are more likely to engage with the paywall and start a trial
- The bottom quartile still struggles, regardless of price. While median and top quartile performers see higher conversion at higher prices, the bottom quartile remains low across all price points. This suggests that simply increasing price doesn’t guarantee conversions—execution matters more than pricing alone
Download to trial conversion by pricepoint

You're missing the full story without the full report
Download the full 263-page report for all sections including: Web Billing, AI Apps, and By-Category Breakouts.
Optimizing onboarding flows to maximize trial start rates is a huge source of leverage for many subscription apps
According to this year’s report, 82% of trial starts occur the same day a user installs an app, which is even higher than last year! With consumer attention spans getting shorter and shorter, the window of opportunity for your business to get new users into a trial has never been narrower. The report also highlights just how much more efficient the top apps are at getting users into trials - p90 apps boast a 20.3% trial start rate, which is >3x better than the median app at 6.2%. Meanwhile, p90 apps are only ~2x more efficient at converting trials into paying subscribers.
The takeaway is that there is massive leverage in findings ways to maximize trial start rates. Specific levers for accomplishing this include:
- Streamlining registration through SSO options like Apple, Google, and Facebook
- Personalizing the new user experience using a brief onboarding quiz
- Maximizing paywall view rate and optimizing paywall design and copy
- Experimenting with different trial formats and lengths
One recent trend I’ve seen is more apps experimenting with reverse trials, where new users get full access to the premium product without needing to provide payment info upfront. While this is a bit of a gamble, it has paid off for companies like Ladder and Strava that have strong enough product / market fit to be confident users will convert at the end of their trials.
Time to trial
By category
- Across all categories, the vast majority of users start a trial immediately upon download, with conversion rates exceeding 80% on Day 0. This suggests that paywall placement and first impressions are critical to driving trial adoption.
Time to trial, by category

See how you stack up with our Subscription Health Calculator
Calculate your app's scoreMost trials will happen on day 0, after that you see diminishing returns - but that doesn’t mean you shouldn’t optimize
It’s crucial to get users to trial as soon as possible, especially when the majority of value is felt with features that are gated or locked behind your subscription. Some key questions to ask yourself are: how early do people see a paywall? Do they have enough context beforehand? Are our paywalls contextual to their location in the product? How many paywalls do people see in their first session? What you’ll find is that trial opt in is directly correlated to how many times a user sees a paywall. However, what’s key is the quality not just the quantity. Quality means: clear value proposition, strong pricing positioning and good user experience (UX). The lowest hanging fruit with trial opt in is typically UX – i.e. where is the paywall - followed by UI: the tactics used on the paywall to position premium as the right next step for the user.
Trial to Paid
By category
- Travel apps have the highest median trial-to-paid conversion rate at 48.7%, closely followed by Media & Entertainment at 43.8%. This suggests that users in these categories find immediate value, likely due to strong content offerings or time-sensitive utility
- Some categories, like Photo & Video and Shopping, show wide gaps between top and bottom performers, indicating that execution matters more than the category itself. The best apps in these spaces convert at nearly three times the rate of those in the bottom quartile
- While Health & Fitness apps have a median of 39.9%, the top 10% convert at 68.3%—one of the highest. This suggests that habit-forming features, community engagement, or premium content can drive stronger conversion outcomes in this category
Trial to paid, by category

By geography
- While Latin America has a median of 25.0%, the top performers reach 53.3%, showing that high-converting apps exist in every market—success may depend more on localized pricing and marketing strategies.
Trial to paid, by geography

By duration
- Longer trials see better conversion rates. Trials lasting 17–32 days have the highest median conversion at 45.7%, suggesting that more time to experience value leads to stronger purchase intent.
Trial to paid, by duration

Trials are your friend so long as they are visible, clear, and appealing to your users
The job of a trial is to allow the user to experience the paid product for just long enough to see the value - and no longer. How long it will take to see this value depends on:
- Who your customer is
- How often they experience the problem you solve
- How much they trust your product and company
If you’re building a database solution for enterprise customers, they might need 180 days to get up to speed and see the value. However, if you’re building a running companion app for serious athletes, they might be able to see the value in 72 hours. It all depends on the context of the user. Getting this right helps trial conversion materially.
As you can clearly see in RevCat’s data, the vast majority of users who will start a trial of an app will do so on the same day that they download your application.
To get them to start a trial quickly, they need to want the product and think the trial is appealing.
To get them to convert in the trial, however, they need to understand and want the product. This comes down to getting the user set up quickly so they experience the value.
Trial cancellations by day
By trial duration
- Shorter trials see the highest early cancellation rates. 3-day and 7-day trials have the highest Day 0 and Day 1 cancellations, suggesting that users may feel rushed to decide or may cancel preemptively to avoid being charged before exploring the app
- Longer trials distribute cancellations over time. 30-day trials see steadier cancellations, with drops occurring throughout the trial period. This suggests users take more time to evaluate, but a longer trial alone isn’t enough to prevent churn—engagement remains key
- A notable cancellation spike occurs toward the end of each trial period, as users set reminders to cancel before getting charged. Retention efforts should focus on this window with targeted messaging or in-app incentives
NOTE: Days 15–30 all recorded between 0% and 1.7% and are not visualized in the graph
Percentage of trial cancellations by day, by trial duration

See how you stack up with our Subscription Health Calculator
Calculate your app's scoreFocus on quality trials, not just quantity
Most trial cancellations happen very early in the user journey. There’s a cohort of users who cancel right away - within minutes of starting their trial.
At Blinkist, we tried targeting these users with specific offers but found that success rates were very low. Our conclusion: they just join for a free sample.
Opportunity in early cancellations
- Early cancellations can be a valuable indicator of the overall quality of a cohort, offering insights for user acquisition efforts. With so many users cancelling right away, it’s been a popular tactic to optimize ad campaigns on Meta and other channels for a “qualified trial” event - one that fires only a few hours into the journey for users still active on their trial.
- While this tactic was hard to pull off under SKAN, given that events could only be fired with users active in the app, platform probabilistic measurement frameworks like Meta’s AEM have made this option viable and popular again.
Focus on quality, not quantity
- As trial-to-paid conversion varies massively by demographic, creative, and other factors, optimizing for qualified trials can help ad platform algorithms separate the wheat from the chaff. Quality trials > quantity trials.
Download to Paid
By Category
- Days 15–30 all recorded between 0% and 1.7% and are not visualized in the graph
- Education and Media & Entertainment lag behind. These categories have some of the lowest Day 35 conversion rates, likely due to high upfront engagement requirements (Education) and alternative monetization options (Media &Entertainment, such as ads)
- The bottom quartile struggles across the board. Even in top-performing categories, the bottom 25% of apps see very low conversion rates. This reinforces that pricing, onboarding, and product experience play a bigger role than category alone
Day 35 download to paid conversion by category

See how you stack up with our Subscription Health Calculator
Calculate your app's scoreBy geography
- The top 10% of apps in every region significantly outperform the median, showing that localized strategies and strong execution matter more than geography alone.
Day 35 download to paid conversion by geography

By access
- Hard paywall apps convert downloads to paid users at a much higher rate than freemium apps, suggesting that a forced commitment model can work—but only if the value is clear upfront
- While the median is low, the top freemium apps still perform well, showing that strong feature gating, well-timed upsells, and premium content can drive paid conversions over time
- While hard paywall apps see higher Day 35 conversion rates, they also risk higher churn if users feel locked in too early. Onboarding and first-time experience are critical
Day 35 download to paid conversion by access method

Maximize conversions with premium positioning and hard paywalls
- Looking at download to paying conversion, North America continues to dominate with an impressive 5.5% upper quartile and 10.5% at P90.
- These numbers should inspire us - especially if you’re targeting the US market with a Health & Fitness, Education, or Business app. Right now, combining premium positioning with a hard paywall is your strongest path to success in these categories.
- The hard paywall data is particularly interesting - we see 12.11% median conversion versus just 2.18% for freemium. Looking deeper at categories, Health & Fitness is hitting 12.1% at P90, with Business at 10.1%. Premium pricing shows strong results too - 2.66% median Download-to-Paying for high-priced apps versus 1.49% for low-priced. But here’s where it gets interesting: lower price points are actually showing stronger trial-to-paid conversion (47.8% versus 28.4% for high-priced).
-
A critical insight: 80-90% of all trials happen on Day 0. This really hammers home how crucial your onboarding experience is - you’ve got one shot to get it right. While data shows longer trials currently converting better at 45.7% versus 26.8% for shorter ones, don’t take this as gospel. The best apps are hitting over 60% trial-to-paid conversion regardless of trial length. That’s where we should all be aiming.Keep an eye on that balance between trial uptake and conversion rate. While lower prices might drive more trials, watch your ARPU closely. Test different price points, but always connect it back to lifetime value.
By price point
- Apps with higher price points see better Day 35 conversion rates, with a median of 2.7% compared to 1.5% for low-priced apps. This suggests that higher-value offerings attract more committed users willing to pay.
Day 35 download to paid conversion by price point

Time to paid
By category
- Across all categories, the majority of trial-to-paid conversions occur immediately, highlighting the importance of first impressions, clear value propositions, and well-optimized paywalls.
Time to paid by category

By geography
- Latin America and ROW have more late-stage conversions. These regions see a higher share of Week 6+ conversions, suggesting that users may need more time, pricing incentives, or reminders before committing.
Time to paid by geography

Download to Trial
- The majority of hard paywall users convert on Day 0, showing that when forced to decide upfront, users either commit quickly or drop off—reinforcing the need for compelling messaging and strong perceived value
- A larger share of freemium users convert weeks after download, suggesting that gradual engagement strategies, well-timed upsells, and feature gating play a key role in long-term monetization
- While hard paywall apps see faster conversions on average, the best freemium apps still achieve strong Day 0 conversion rates, proving that execution matters more than monetization model alone
You're missing the full story without the full report
Download the full 263-page report for all sections including: Web Billing, AI Apps, and By-Category Breakouts.
Download to Trial, By Access

Dive deeper
 Sylvain Gauchet, Babbel
How to build more successful paywalls
Listen now- Rachel Chukura, The Weather Company

How to optimize trial-to-paid conversions
Listen now

Monetization
Trial strategy
By category
- Health & Fitness apps are the most likely to use a mixed trial strategy (56%), while Shopping & Social & Lifestyle apps have the highest share of no trial strategy (44%). Gaming apps are among the most likely to adopt a pure trial strategy (34%)
Trial Strategy by category

Trial Durations
Year over year
- In 2024, over half (52%) of all trials were offered for 5–9 days, up from 48.5% in 2023. Meanwhile, shorter trials (4-day-or-less) declined, suggesting a shift toward slightly longer trial periods across app categories.
Trial durations year over year

By category
- Gaming apps overwhelmingly favor shorter trials, with 96.3% lasting four days or less. This could suggest that developers prioritize quick conversions, possibly due to high engagement within the first few days
- Education & Health & Fitness apps stand out for their longer trial durations, with over 80% lasting 5–9 days or more. This could reflect the need for users to experience enough content before committing, especially in environments where progress takes time
- Media & Entertainment and Travel apps have a more balanced trial distribution, with a significant portion of trials extending beyond 9 days, giving users more time to experience & evaluate their services before converting into paid subscriptions
Trial durations by category

Price Points
By plan duration, year over year
- In general, median prices remained flat year-over-year. However, the most expensive apps got even more expensive, with P75 and P90 prices rising slightly across most plan durations.
Price points by plan duration year over year

Median price by category
Median price per plan duration by category

Median price by geography
Median price per duration by geography

Experiment, go premium, and communicate value clearly
Pricing consumer subscription software in 2025 can feel like navigating a maze blindfolded. There’s no single answer to how much something should cost - do you prioritize subscribers, margins, or revenue? To find the right approach, focus on three things: experiment, don’t be afraid to be premium, and clearly explain the value to your customers.
Experiment
- RevenueCat data shows a wide range of successful price points, with the median CSS app at $29.99 and the upper quartile pricing almost 3x higher. Constant A/B testing is essential to find what works best. Don’t get stuck in analysis paralysis - try different price points and learn from the results.
Go premium
- Consumers are willing to pay a premium for products that truly solve their problems. Don’t be afraid to price your app accordingly, especially if it delivers unique value. Price elasticity varies by market, but the “why” behind the purchase is universal. Make sure your app’s value justifies the cost.
Communicate value clearly
- In a world full of freebies, it’s crucial to communicate your app’s value quickly and effectively - especially during the first hour of download. Highlight the unique benefits that set your app apart and make the value obvious to users.
Get out there and build! Just remember: A/B test like a scientist, go premium with confidence, and communicate value like a storyteller
You're missing the full story without the full report
Download the full 263-page report for all sections including: Web Billing, AI Apps, and By-Category Breakouts.
Share of subscriptions sold
By category
- Yearly subscriptions dominate Health & Fitness (67%) and Travel (65%), while Gaming (78%) relies heavily on weekly plans. Yearly plans make up the largest share of subscriptions across 7 of 12 categories, as developers prioritize longer commitments.
Share of subscriptions sold by category

By geography
- IN/SEA (36%) and MEA (35%) tend to rely more on weekly plans than other regions. Yearly subscriptions make up the largest share in Asia-Pacific (47%) and North America (43%), while Monthly subscriptions are fairly consistent across regions.
Share of subscriptions sold, by geography

“Let’s just get rid of the monthly plan...”
I wouldn’t be so quick to go there just yet!
For years now publishers have been actively pushing annual plans. And for good reason - faster payback and stronger realised LTV. And yeah, it’s worked. Annual plans are winning.
But driving up the % of users on an annual plan may not be the best thing for your app. Not
all categories lend themselves to long term commitments. And forcing it runs the risk of lowering total revenue.
Let’s look at the numbers:
-
Weekly plans dominate in Business, Social & Lifestyle, and Gaming—as much as annual plans dominate in Health & Fitness, Travel, and Education.
-
Monthly plans thrive in Shopping, Media & Entertainment, where commitment is lower, but recurring spend is high.
-
And it gets even trickier across geos. What works in one market might tank in another. No one-size-fits-all here.
So, the real questions are:
-
What commitment length does our value proposition naturally support?
-
How do we serve the right plan, at the right time, in the right market; to maximize realized LTV without harming overall revenue?
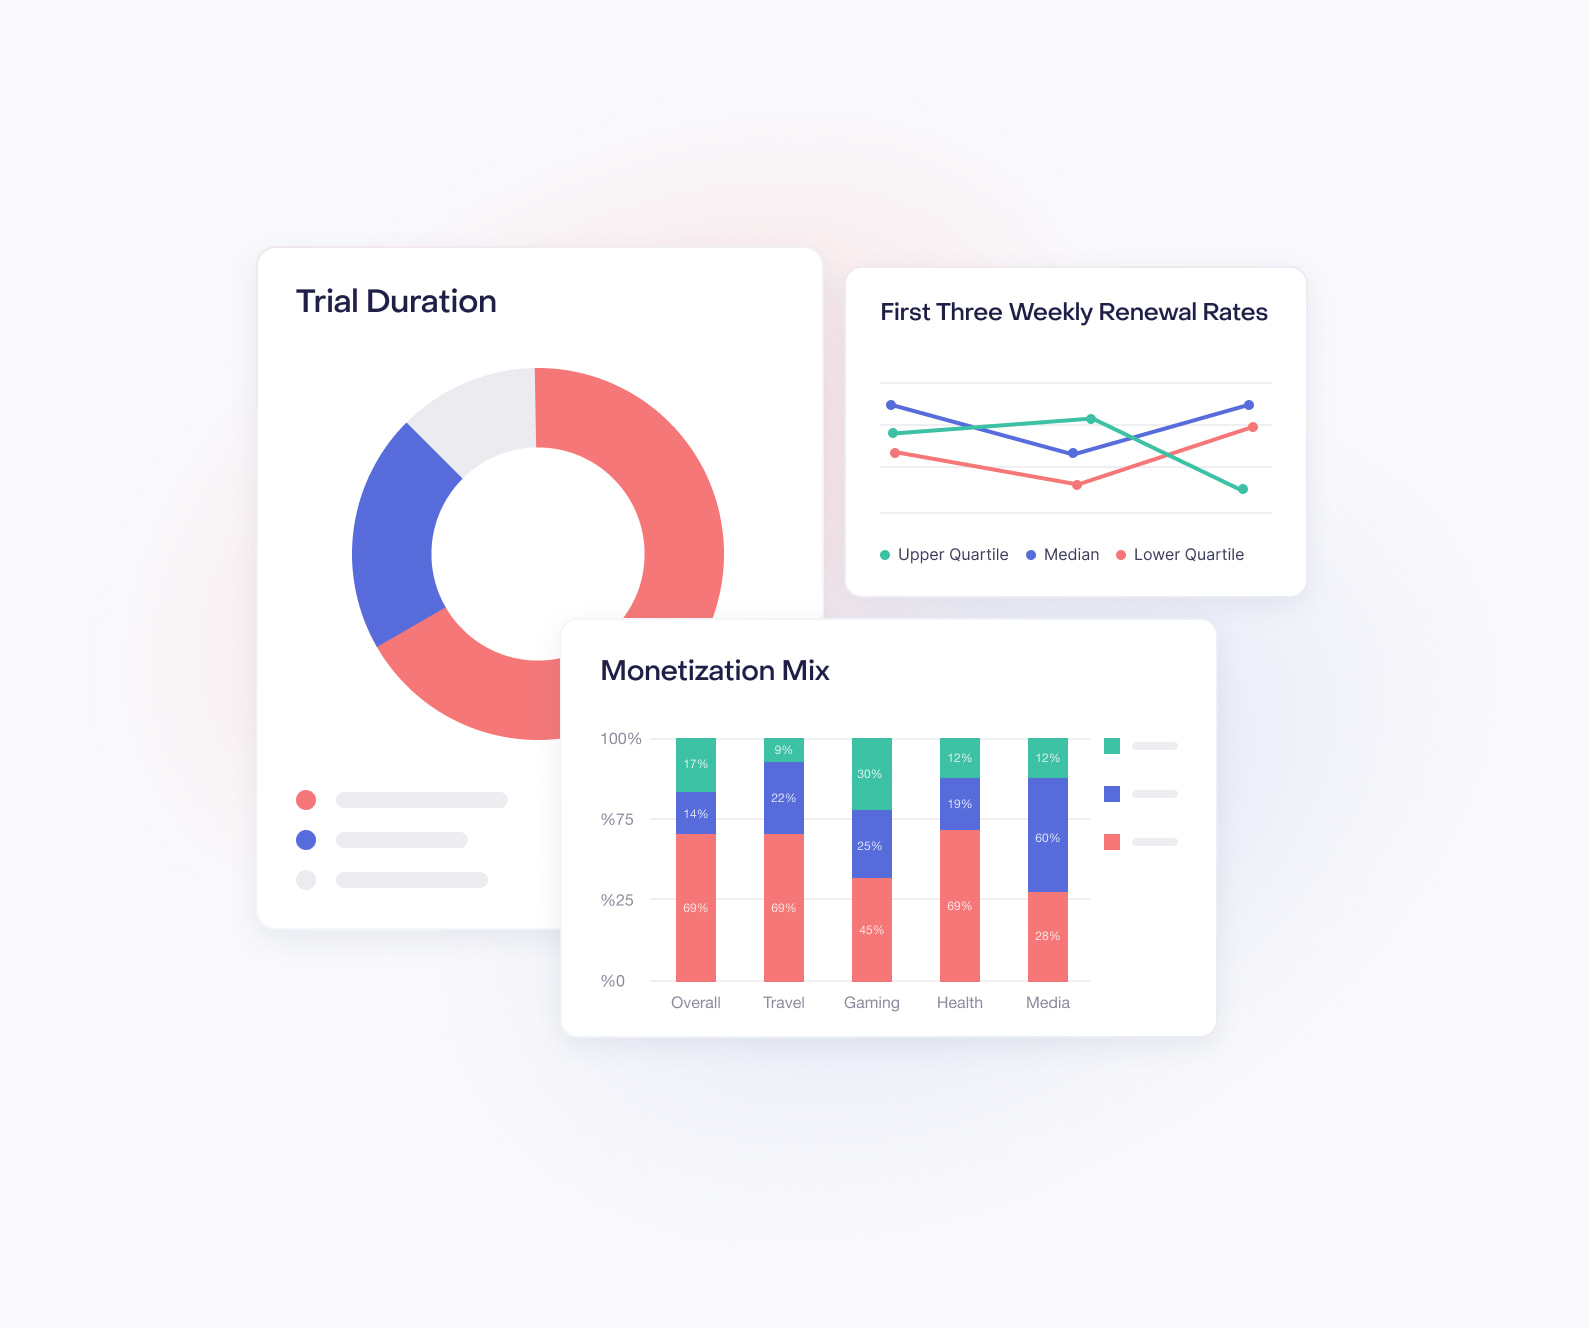
Monetization mix
- Most categories rely heavily on subscriptions only. Nearly 20% of Social & Lifestyle apps offer a combination of Subscriptions & Consumables, while Gaming apps continue to lean into a more even mix of monetization strategies.
Monetization mix by category

Boost LTV by combining subscriptions with consumables
- One of the most overlooked strategies for subscriptionapps is adopting a hybrid monetization model that combines subscriptions with consumable in-app purchases. While gaming apps have successfully leveraged this approach for years, subscription-based apps are lagging behind.
- Based on the data, gaming apps have a strong mix of both subscriptions and consumables, demonstrating how this model can work effectively. However, most non-gaming categories remain heavily reliant on subscriptions alone, missing out on additional revenue streams. For instance, Health & Fitness and Productivity apps primarily focus on subscriptions, while consumables remain under-utilized.
- By integrating consumables—such as one-time purchases for premium content, AI-generated insights, or feature unlocks—subscription apps can better capture user demand and increase overall LTV. Users who may not commit to a full subscription might still be willing to make smaller purchases, providing an additional revenue layer.
The key takeaway here is that hybrid models allow apps to monetize different user segments more effectively, reducing churn and improving retention. As the subscription market matures, adopting this strategy will be crucial for sustained growth and profitability. Subscription apps need to take inspiration from gaming and embrace diversified revenue models to stay competitive.
Offer Usage
- Most categories rely heavily on subscriptions only. Nearly 20% of Social & Lifestyle apps offer a combination of Subscriptions & Consumables, while Gaming apps continue to lean into a more even mix of monetization strategies.
Offer usage by category

Dive Deeper
- Brandon Gador, onX Maps

How to increase monetization with targeted upsells
Listen now - Dmitry Gurski, Flo

How to maximize revenue with regional pricing
Listen now
Revenue
Average revenue per install
After 14 Days, Split By App Category
- On average, apps in the upper quartile make 2.75x more than the median after 14 days. Health & Fitness apps lead all categories with a median 14-Day ARPU of $0.44 and an upper quartile value of $1.31.
Average revenue per install after 14 days, split by app category

You're missing the full story without the full report
Download the full 263-page report for all sections including: Web Billing, AI Apps, and By-Category Breakouts.
After 60 Days, Split By App Category
- Health & Fitness apps continue to dominate long-term revenue per install, with the highest P90 value ($4.19) and strong performance across quartiles. Their ability to more than triple the median ($0.63) by P90 suggests strong retention, upselling, and recurring revenue potential
- Education apps show a significant revenue jump at the high end, with P90 ($3.13) nearly eight times the median ($0.40). This indicates that while most apps earn modestly, top performers monetize exceptionally well—possibly through longterm subscriptions, premium content, or bundled educational resources
- Photo & Video, Social & Lifestyle, and Travel apps show similar trends, where top apps earn 5–7 times more than the median, showing that while monetization can be challenging in competitive categories, premium or niche offerings allow certain apps to generate significantly higher revenue than their peers
Average revenue per install after 60 days, split by app category

How to use segmentation to maximize LTV
- Segment early to acquire the right users: Long-term retention starts before users even download your app. Ladder segments potential users through quiz-based onboarding, tailoring messaging and acquisition strategies to fitness personas. Speaking to the right audience from the start leads to higher engagement and better retention.
- Optimize trial experience for activation, not just conversion: Instead of pushing for immediate sign-ups, Ladder removes credit card barriers and focuses on getting users to complete their first workouts. Those who finish at least two workouts in the trial are far more likely to convert and remain subscribers long-term.
- Match pricing offers to user engagement: Not all trial users should see the same offer. Ladder segments post-trial users based on their workout completion history. Engaged users are encouraged to commit to annual plans, while inactive users see monthly offers with first-month discounts to lower the barrier to entry.
After 14 Days, Split By Geography
- North America leads in revenue per install ($0.39 Median), while Asia-Pacific is not far behind. Meanwhile, IN/SEA and Latin America see the lowest median values ($0.06–$0.09), highlighting regional monetization disparities.
Average revenue per install after 14 days, split by geography

After 60 Days, Split By Geography
- North America and Asia-Pacific continue to lead in 60 revenue per install. Median values in these regions are on par with the upper quartile marks in most other regions.
Average revenue per install after 60 days, split by geography

After 14 & 60 Days, Split By Plan Duration
- Monthly plans see the highest jump in revenue per install between day 14 and day 60 – with the upper quartile rising from $0.56 to $0.87 and P90 rising from $1.63 to $2.44.
Average revenue per install after 14 and 60 days, split by plan duration

After 14 Days, Split By Access Method & Pricepoint
- Average revenue per install is highest after 14 days for high-priced apps (as expected). Median 14-day revenue is approximately 8x higher for apps with hard paywalls vs. those with freemium models.
Average revenue per install after 14 days, split by access method and pricepoint

After 60 Days, Split By Access Method & Pricepoint
- Average revenue per install continues to grow across all price points and access types from day 14 to day 60 – with median values growing by an average of 51%.
Average revenue per install after 60 days, split by access method and price point

Early monetization varies by category – optimize accordingly
The Revenue per Install (RPI) data reveals significant differences in early monetization across app categories. Health & Fitness apps dominate with a median RPI of $0.44 and a P90 of $2.97, suggesting strong early subscription adoption. Business ($0.29) and Education ($0.27) apps also perform well, likely due to premium content and professional tools. In contrast, Gaming ($0.08 median) struggles with early monetization, relying on long-term engagement and in-app purchases.
Key actionable tips for developers: Steve P. Young Founder and CEO of App Masters
- Prioritize subscriptions for high-monetizing categories – Health, Business, and Education apps should focus on free trials, higher yearly prices ($99.99 and up), and consider hard paywalls.
- Optimize early engagement for low-RPI apps – Gaming, Social, and Media apps need strong retention strategies before monetization.
- Leverage in-app purchases and upsells – Travel, Productivity, and Utility apps can benefit from freemium models with premium features.
- Improve first-week monetization in Shopping – Encourage early purchases with limited-time discounts or personalized offers.
- A/B test onboarding and paywalls – Apps with high P90 values show some users will pay a lot early - test pricing models to maximize revenue. By focusing on early user behavior and category-specific strategies, developers can boost revenue and optimize their monetization approach.
Realized LTV per payer
After 1 Month, By Category
- Health & Fitness apps lead in payer LTV, with median ($16.44) and upper quartile ($31.12) values exceeding all other categories. Business apps show a large gap between median ($14.82) and P90 ($52.41), suggesting strong monetization potential for top performers.
Realized LTV per payer after 1 month, by category

After 1 year, by category
- Across all categories, LTV rises by nearly 60% month 1 to year 1. Shopping and Travel apps show some of the largest percentage increases in upper quartile LTV from month 1 to year 1, suggesting strong long-term spending from engaged users despite lower initial revenue per payer
Realized LTV per payer after 1 year, by category

After 1 Year, By Access Method or Pricepoint
- Higher prices lead to significantly higher LTV, with high-priced apps generating nearly 7x the median LTV ($55.21) compared to low-priced apps ($8.08), showing that premium pricing captures more long-term value per payer
- Lower-priced apps struggle with long-term monetization, with a P90 of just $22.43, showing that even top-performing low-cost apps fail to match the revenue potential of mid- and high-priced apps
- The gap between upper quartile and P90 is largest in high-priced and hard paywall apps, suggesting that a subset of apps in these categories drive exceptionally high long-term value per payer
Realized LTV per payer after 1 year, by access method or price point

After 1 Year, By Geography
- Western Europe and North America lead in LTV, with median values and P90 values exceeding all other regions. LTV more than triples from median to P90 across all regions.
Realized LTV per payer after 1 year, by geography

Rethink your pricing and paywalls to boost Year 1 Realized LTV
First: Higher prices still mean higher Year 1 Realized LTV. If you haven’t tested pricing in the last 6-9 months, it’s time to run new experiments!
- Make sure you understand the kind of noise to expect (e.g., run an A/A test first).
- Do not judge results based on short-term Realized LTV per customer. Anything that isn’t a clear-cut win (e.g., 5-10 points above the A/A “noise”) might flatten out or even become a loss after Year 1 renewals (and the refunds that come with it).
- If you make an early call for cash flow reasons, revisit results often. Next, should you have a hard paywall? As Thomas Petit puts it, mobile growth is a business model competition — and the D60 and Year 1 Realized LTV for hard paywalls are pretty compelling. There are many factors to consider, but if you’re early-stage, really need the cash flow, and/or don’t have a clear freemium strategy, then it might be time to prioritize testing a hard paywall. Finally, it’s worth looking at top apps in the Business category, as they by far lead the pack in Year 1 Realized LTV.
- Next, should you have a hard paywall? As Thomas Petit puts it, mobile growth is a business model competition — and the D60 and Year 1 Realized LTV for hard paywalls are pretty compelling. There are many factors to consider, but if you’re early-stage, really need the cash flow, and/or don’t have a clear freemium strategy, then it might be time to prioritize testing a hard paywall. Finally, it’s worth looking at top apps in the Business category, as they by far lead the pack in Year 1 Realized LTV.
Share of Newly Launched Apps that Hit Revenue Milestones in Their First 2 Years
- Photo & Video are enjoying a good run and have the highest success rates, with 27.57% reaching $1,000 and 8.75% hitting $10,000 within 2 years, suggesting strong early monetization potential compared to other categories
- Across all categories, nearly 20% reach $1,000 in revenue while 5% reach the $10,000 mark. Revenue drop-off is steep, with many categories losing ~50% of
apps at each milestone, emphasizing the challenge of sustained growth beyond early revenue benchmarks
Share of Newly Launched Apps that Hit Revenue Milestones in Their First 2 Years

You're missing the full story without the full report
Download the full 263-page report for all sections including: Web Billing, AI Apps, and By-Category Breakouts.
Median Number of Days from Launch to Revenue Milestones
- For the apps that make it there, the median number of days to reach $1,000 is 60. Health & Fitness, Photo & Video, and Utilities apps show some of the most consistent growth to later milestones beyond that mark.
Median Number of Days from Launch to Revenue Milestones

Retention & Reactivation
Retention
- Retention varies widely by category. Media & Entertainment, Travel, and Shopping see some of the highest monthly plan retention rates, while categories like Gaming and Social & Lifestyle show notably lower retention across both plan types
- Weekly plan retention is uniformly low. Across all categories, weekly plan retention rarely exceeds 10% at six months, with many categories seeing retention below 5%, highlighting the challenge of retaining short-term subscribers
- Social & Lifestyle apps struggle with long- term retention. This category shows the lowest retention rates for both weekly and monthly plans, indicating high churn and potential challenges in sustaining user engagement beyond the initial subscription period
NOTE: This chart shows the bottom quartile, median, upper quartile, and top 10% of performance, in order, from the bottom up
Retention of Weekly & Monthly Plans 6 Months in, By Category

Yearly plans significantly outperform monthly and weekly plans in 12-month retention across all categories, with some exceeding 50-60% retention, compared to 20-40% for monthly and under 10% for weekly.
Retained Subscribers After 1 Year, By Plan Duration

- Yearly plans maintain the highest retention rates, but retention has slightly declined from 47.1% in the previous period to 44.1% in this period. Despite this drop, annual subscribers still outperform other plan durations by a wide margin
- Monthly plan retention decreased from 18.8% to 17.0%, suggesting potential churn challenges or shifts in user engagement. This could indicate either pricing adjustments, product experience changes, or evolving user behavior
- Weekly plan retention remains the lowest, declining from 4.2% to 3.4%, reinforcing the idea that weekly subscriptions serve
as short-term trials rather than long-
term commitments. This underscores the importance of upselling weekly subscribers to longer-term plans
Year 1 Retention Compared to the Previous Period, By Plan Duration

- Yearly plans have the highest retention across all price points, with low-priced plans retaining up to 53.7% of users
and high-priced plans still maintaining 48.3% retention. This suggests that users committing to annual plans tend to stay engaged regardless of price - Monthly retention decreases as price increases, with 22.5% retention for low- priced plans, 16.4% for mid-priced, and only 12.2% for high-priced. This indicates that higher-cost monthly subscriptions may face stronger churn pressures
- Weekly plans consistently underperform across all price points, with retention hovering around 3-6%. This reinforces the idea that weekly subscriptions function primarily as short-term trials rather than sustainable retention drivers
Retained Subscribers After 1 Year, By Pricepoint

- Freemium access leads to higher yearly plan retention variability, ranging from 18.7% to 59.0%. This suggests that different app categories or acquisition strategies may significantly impact long-term retention under the freemium model
- Weekly plans show the lowest 12-month retention across both access methods, with median rates under 6.5%. This reinforces the trend that short-term plans often struggle to convert users into long-term subscribers
- Monthly retention under a hard paywall outperforms freemium, with a median of 12.8% versus 9.3%. This suggests that users who commit to a paid experience upfront may be more engaged than those entering through a free tier
Retained Subscribers After 1 Year, By Access Method

Only a small percentage of users pay for subscriptions, so you’d think the most committed ones would stick around. And yet, churn hits hard: on monthly plans, barely 10% of payers reach the second year. On weekly plans, less than 5% make it to month 6! There is hope: the best defy those odds. This is especially true in Travel, Shopping, Media, and Business categories. “Never tell me the odds,” said Han Solo. Instead, use this benchmark to aim for the very top: the upper quartile retain 60-75% on yearly plans - twice the median!
Cherrypicks from RevenueCat’s data trove & potential actions:
- The first renewal has the biggest impact, with 30-50% churn on weekly plans and 15-40% on monthly. — It’s usually easier to prevent than cure. Analyze what active retainers did early on that others didn’t, and surface this value to more users.
- North America often shows higher conversion rates, but Europe & Asia-Pacific retain as much. — Always consider the full revenue picture.
- Shorter plans have much lower Year One renewals, and weekly plans show the steepest decline YoY (-27%!). — Annual subscriptions can help pay back high acquisition costs faster but also yield longer-term benefits.
- 2 to 5% of payers will claim a refund (more in Health & Fitness and Education). — Monitor closely and use RevenueCat’s new feature to reduce refunds significantly.
- Renewal rates show extreme variance by duration (weekly the hardest), price point (higher price correlates with lower renewal), regions, and more. Average Y1 retention is up overall despite being down on all individual segments. — Segment to isolate your best and worst performers, shift the combination, and avoid the trap of averages
Renewals
Weekly plans exhibit the lowest retention, with some categories like Social & Lifestyle and Entertainment dropping below 50% by the third renewal. This suggests weekly subscriptions may function more as short-term trials rather than long-term revenue drivers.
First 3 Weekly Subscription Renewals, By Category

Gaming and Social & Lifestyle show the most variability, with some apps retaining well over 75% of subscribers while others drop closer to 50%. This signals that app-specific factors heavily influence user retention in these segments.
First 3 Monthly Subscription Renewals, By Category

Annual renewals show the highest long-term retention, exceeding 85% in several categories. Business and Utilities lead in user commitment, suggesting these verticals provide ongoing value that justifies yearly renewals.
First 2 Annual Subscription Renewals, By Category

This period saw slightly lower first and second renewal rates compared to the previous period, particularly in the first renewal (61.7% vs. 64.9%). This could indicate shifts in user behavior, pricing strategies, or acquisition sources
Third renewal rates remain strong across both periods, exceeding 77% in both cases. This suggests that once users commit beyond two renewals, they are significantly more likely to remain subscribers
The drop in first-to-second renewal rates is more pronounced in this period, with a sharper decline from 61.7% to 53.4%. This could indicate retention challenges early in the subscription lifecycle
Median Renewal Rates, By Subscription Duration, Compared to the Previous Period

North America and Western Europe lead in retention, with third renewal rates exceeding 79%, suggesting strong long-term engagement in these markets.
Median Subscription Renewal Rates, By Geography

Low-priced subscriptions retain best over time, with third renewal rates exceeding 79%, suggesting affordability drives sustained engagement.
Median Subscription Renewal Rates, By Pricepoint

- Weekly plans exhibit the lowest active renewal rates, often below 30%, highlighting that short-term subscribers are less likely to remain engaged between renewals. This suggests that weekly plans may function more as trial periods rather than ongoing commitments
- Shopping and Health & Fitness apps retain high engagement across renewal periods, with strong active renewal rates in both monthly and yearly plans. This suggests these categories effectively keep users engaged between billing cycles
- Gaming, travel, and utilities struggle with active renewal rates, particularly for shorter durations, indicating that users in these categories may be more transactional or less consistently engaged over time
Active Renewal Rate, By Category

Refund Rate
By App Category
- Education and health & fitness apps have the highest refund rates, at 4.86% and 4.71% respectively. This suggests potential issues with user expectations, unclear pricing, or aggressive upselling
- Travel apps have the lowest refund rate (1.51%), likely due to higher purchase intent and the necessity-driven nature of subscriptions in this category
- Gaming and business apps see lower-than- average refunds (2.67-2.88%), suggesting users may better understand their value proposition before subscribing
Refund rate by app category

You're missing the full story without the full report
Download the full 263-page report for all sections including: Web Billing, AI Apps, and By-Category Breakouts.
By Geography
Western Europe and Asia-Pacific have relatively lower refund rates (below 3.0%), which may indicate stronger user trust, better subscription transparency, or more stable payment infrastructures.
Refund rate by geography

By pricepoint
- Low-priced plans have the lowest refund rate (2.2%), reinforcing the idea that lower financial risk leads to fewer refund requests.
Refund rate by pricepoint

By access method
- Hard paywall apps see significantly higher refund rates (5.8%) compared to freemium apps (3.4%). This suggests that users who are required to pay upfront may experience more dissatisfaction or unmet expectations
- The large refund gap between access methods highlights the importance of clear value communication. Hard paywall apps may benefit from enhanced onboarding, clearer pricing, or refund mitigation strategies
- Refund trends suggest that user expectations play a key role. If an app lacks trial opportunities, users may be more likely to request refunds after purchase
Refund rate by access method

Cancellation Reasons
By app store
- Unsubscribing is the dominant reason for cancellations on both platforms, accounting for 74.5% on the App Store and 67.2% on Google Play. This suggests that user churn is more often voluntary than due to external factors
- Billing errors contribute to 28.2% of cancellations on Google Play, significantly higher than the 15.1% on the App Store. This could indicate regional payment processing challenges or lower transaction success rates on Google Play
- Price increases are not a reported reason for cancellations, suggesting that pricing changes either rarely occur or do not significantly impact subscriber retention
Cancellation reasons by app store

Google Churn Survey Answers
“Not enough usage” is the top cancellation reason across all categories, with rates ranging from 32% to 47%. This suggests that many churned users did not find ongoing value in their subscriptions.
Google churn survey answers, by category

Cancellation Timeline
- The first month sees the highest cancellation spike across all categories, often exceeding 30%. This suggests that many users opt out early, possibly due to second thoughts after purchase or concerns about a ‘forgotten renewal’ later on.
Cancellation timeline for annual subscriptions

Monthly plans reactivate best, but higher-priced tiers drive stronger returns.
Monthly subscriptions drive the highest reactivation rates, while yearly plans struggle
- Monthly subscriptions have the highest reactivation rates, likely due to lower commitment barriers. Weekly plans follow at 9.37%, while yearly plans struggle at 4.58%, emphasizing the need for a strong and evolving value proposition to retain annual subscribers. Photo & Video and Productivity lead in monthly reactivations, while Gaming underperforms, perhaps due to player fatigue. Shopping also struggles, possibly due to limited recurring engagement. Yearly reactivations are strongest for Media & Entertainment and Photo & Video, which both benefit from continuous content refreshes.
- North America leads in monthly and weekly reactivations but struggles yearly. In contrast, MEA and Western Europe show stronger yearly retention, indicating long-term user commitment.
Higher-priced plans show stronger reactivations
- Reactivation rates rise with pricing tiers, likely due to higher perceived value, stronger initial commitment, and sunk cost effects. Low-priced plans see the lowest reactivation rates as they attract casual users with weaker brand attachment or lower disposable income. The small gap between mid and high-priced tiers suggests publishers should experiment with pushing higher-priced plans.
Churners
By app category
- Weekly plans show a strong reactivation trend in shopping (18.3%), indicating that short-term churners may still find value in occasional access to these services.
Share of churners that reactivate in year 1, by app category

By Geography
Monthly churners have the highest reactivation rates across all regions, exceeding 13% in most cases. This suggests that short-term churners are more open to returning compared to longer-term subscribers.
Share of churners that reactivate in year 1, by geography

By pricepoint
Higher-priced subscriptions have the highest reactivation rate (11.9%), suggesting that users who leave premium plans may still see enough value to return within a year.
Share of churners that reactivate in year 1, by pricepoint

Dive Deeper
- Jason van der Merwe, Stava

How to secure the first renewal
Listen now - Caroline Walthall, Quizlet

How to re-engage churned users
Listen now - Jackson Shuttleworth, Duolingo

How to time reactivation campaigns for maximum impact
Listen now
Acquisition
Cost Per Install
- The CPI gap between iOS and Play Store in North America is striking, with iOS CPIs reaching nearly 3x those of Play Store in some categories
- Cost per install varies significantly across categories, with Photo & Video leading the pack especially on iOS, where the top quartile sees CPIs above $14. The high CPI for this category could be attributed to the competitive landscape
- North America’s Play Store CPI is lower than the Play Store’s, but still sees notable differences by category. Western Europe sees a substantial drop in CPI compared to North America although the variation between categories remains similar
Cost per Install, By Category and By Store

How to optimize user acquisition across major ad channels
- Signal recovery is improving ad efficiency: iOS signal loss made UA harder, but advanced self-attributing networks (SRNs) on TikTok, Meta, and Snapchat are restoring key data points. Apple Search Ads now supports view-through attribution, helping capture conversions that might have been missed.
- Web-to-app funnels create new acquisition opportunities: More apps are using landing pages and web subscriptions to capture high-intent users before directing them to the app. Meta and Google Ads support these flows, allowing apps to bypass platform fees and test more flexible pricing strategies.
- Reddit and alternative channels are gaining traction: Reddit is investing in app install campaigns, making it an overlooked but promising UA channel - especially for niche communities. AppsFlyer data shows growing spend across multiple platforms, as confidence in attribution continues to improve.
Cost per Paying User on iOS
- Cost per paying user (CPPUs) varies dramatically by region, with Africa and the Indian Subcontinent showing extreme outliers. Japan & Korea and North America see elevated CPPUs in Generative AI and Lifestyle apps, whilst emerging markets like Eastern Europe and LATAM maintain lower CPPUs across most categories.
Cost per Paying User on iOS, By Category & Geography

Cost per Paying User on Android
Books & Reference apps in ANZ have the highest CPPU, while Utility, Health & Fitness, and Generative AI apps see elevated CPPUs in premium markets. Gaming apps and emerging markets tend to have lower CPPUs.
Cost per Paying User on Android, By Category & Geography

Google Play & the App Store
Median Price per Plan
- Annual subscription prices are generally higher on the App Store than Google Play, except in North America. Monthly and weekly plan prices show more variation across regions, with some emerging markets seeing significantly lower prices on Google Play.
Median price per plan duration by geography

Download to Paid Conversion
- Day 35 download-to-paid conversion rates are consistently higher on the App Store than Google Play across all categories, with Business, Health & Fitness, and Education apps showing the largest gaps.
Note: This chart shows the bottom quartile, median, upper quartile, and top 10% of performance, in order, from the bottom up
Day 35 download to paid conversion by category

Trial Conversion to Paid
- Google Play outperforms the App Store in trial conversion for Business and Media & Entertainment, with medians of 42.6% and 41.2%, respectively. This may indicate stronger regional adoption or user trust in these categories.
Trial conversion to paid by category

Offer Usage
- The App Store drives significantly higher offer adoption, with 17.6% of users utilizing some form of offer, compared to just 7.3% on Google Play. This suggests that Apple’s ecosystem encourages more promotional usage
- Introductory offers dominate offer usage, representing 13.5% of transactions on
the App Store and 5.9% on Google Play. These offers are a key driver of trial-based acquisition on both platforms - Despite offer adoption differences, a majority of transactions on both platforms occur without offers, with 82.3% on the App Store and 92.7% on Google Play. This underscores that core pricing strategy remains the primary revenue driver
Offer usage by store & offer type

Revenue per Install
- North America leads revenue per install across both platforms, with median values of $0.66 on the App Store and $0.35
on Google Play. This highlights strong monetization in premium markets - The App Store consistently outperforms Google Play across all regions, with global median D60 revenue at $0.38 versus $0.14, reinforcing Apple’s stronger monetization potential
- Google Play sees its highest revenue
per install in Asia-Pacific ($0.35 median), reflecting strong growth potential in this region compared to other emerging markets
Revenue per install after 60 days, by geography

Year 1 Realized LTV
By Geography
- Asia-Pacific shows competitive performance between stores, with median LTV near $35. This suggests strong growth potential in subscription monetization across the region.
Realized LTV per payer after 1 year, by geography

By category
- Business and Health & Fitness categories generate the highest LTV across both platforms, exceeding $25 median LTVs, reflecting strong demand for productivity and wellness subscriptions
- The App Store generally leads Google Play in LTV across categories, though the gap is narrower in Health & Fitness and Business, where Google Play’s top quartile LTV rivals Apple’s
- Media & Entertainment sees the widest LTV distribution, with top quartile LTVs reaching $32.55 on the App Store and $27.91 on Google Play, indicating strong performance among top apps
Realized LTV per payer after 1 year, by category

First 3 Renewals, By Plan Duration
- Google Play leads in first-month renewal rates, outperforming the App Store across plan durations. However, the App Store catches up by the second and third renewals, particularly for annual plans.
First 3 renewals by plan duration

Platform Revenue Split by Geography
- The vast majority of apps generate most of their revenue from the App Store, with over 67% of apps in every region earning at least 80% of their revenue from iOS users. This highlights Apple’s stronger monetization potential
- Very few apps rely exclusively on Google Play, with only 10-14% of apps in each region making all their revenue from Android users. Even in Google Play’s strongest regions, most apps still see substantial revenue from iOS
- Emerging markets like Latin America and India/Southeast Asia have the highest proportion of apps generating more balanced revenue, with around 10% of apps earning 50-70% of revenue from the App Store. This suggests more parity between platforms in price-sensitive regions
Platform revenue split by geography

Cancellation Reasons, By Store
- Billing errors are significantly higher on Google Play (28.2%) than the App Store (15.1%), suggesting potential payment processing challenges or regional discrepancies in Android’s billing system
- Unsubscribing is the leading cancellation reason on both platforms, accounting for 74.5% of cases on the App Store and 67.2% on Google Play, highlighting voluntary churn as the primary factor
- Subscription pauses and developer- initiated cancellations are rare on both platforms, making up less than 1% of cases, reinforcing that most churn is user-driven
T10: Cancellation reasons by app store

Dive Deeper
- Tammy Taw, Google

How to unlock revenue growth on Google Play
Listen now - Matt Rouif, Photoroom

How to succeed on iOS vs. Android
Listen now
Native & Crossplatform
Download to Paid, By Framework
- React Native leads in conversion rates, with a median of 2.2% and a 90th percentile of 11.2%, suggesting that apps built with this framework may optimize better for monetization.
D35 Download to Paid, By Framework

Revenue per Install, By Framework
- Native and Flutter apps see comparable median revenue (~$0.19), but Flutter apps reach a higher 90th percentile ($1.55 vs. $1.11), indicating stronger top-tier performance.
D14 Revenue per Install, By Framework

Revenue per Install, By Framework
- React Native maintains the strongest revenue growth, with a median of $0.44 and a 90th percentile reaching $3.54, indicating sustained monetization beyond early installs
- Flutter apps overtake Native apps at the upper quartile and 90th percentile, with a high-end performance of $2.29 vs. $1.53, suggesting that top-tier Flutter apps can drive stronger revenue
- Other frameworks show a highly variable revenue spread, with a lower median ($0.29) but a strong 90th percentile ($2.94), suggesting some apps monetize exceptionally well while others struggle
D60 Revenue per Install, By Framework

Year 1 Retention By Plan, per Framework
- Flutter and React Native show slightly weaker retention in both monthly and annual plans compared to Native and Other frameworks, suggesting that app experience or payment optimization may be a factor.
Year 1 Retention By Plan, per Framework

AI is explosively changing the way that people build apps and Expo is right at the center of it.
Tools like Bolt, Replit, Create.xyz, and others have launched partnerships with Expo so that anyone can build React Native apps just from a prompt. We’ve seen this AI app movement erupt in the last month and I expect it to change everything about the way apps are built over the next year plus.
The React Native and React ecosystems are converging. A good example of this is the Bluesky app, which is built with Expo and targets web, iOS, and Android all from one code base. This convergence is happening because Expo Router has matured and made it a lot easier to unify web and iOS/Android. We’re seeing more and more teams of web devs shipping truly universal apps with Expo.
React Native itself has matured and become easier to work with. In particular, writing your own native code and using native code libraries has become simpler and more maintainable. A lot of the apps that you might think are native are now React Native with one or two screens written in Swift/Kotlin. And sometimes apps you think must be Swift/ Kotlin because they seem so slick are just all React Native JavaScript, like the Starlink app.
A critical mass of popular and successful React Native apps is driving a cycle where even more apps are built the same way. Shopify, Discord, Coinbase, Pizza Hut, Burger King, Sweetgreen, Brex, Phantom Wallet, the NFL app, Partiful (which just won the Google Play Best App of the Year award) and almost every news app you’ve heard of. The list goes on.
Recently, Gergely Orosz from The Pragmatic Engineer reported that almost all VC funded startups in the US are choosing React Native when they need an app. We’ve reached the moment where React Native has matured into the default way to build new apps. And it feels like this is just the beginning.
Y1 Realized LTV per Payer by Framework
- React Native generates the highest long- term revenue per paying user, with a median of $22.80 and a P90 of $85.26, suggesting strong lifetime value from engaged users
- Flutter trails slightly behind Native at the median level ($13.81 vs. $16.15) but exceeds it at the upper quartile and beyond, showing that top-performing Flutter apps can monetize more effectively
- Other frameworks demonstrate strong performance at the high end, with a 90th percentile LTV of $70.90, indicating that some alternative approaches can yield competitive returns
Y1 Realized LTV per Payer by Framework

See how you stack up with our Subscription Health Calculator
Calculate your app's score